OLED graphs: pointer (internal_oled_draw_needle_meter)
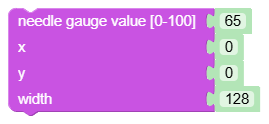
What it does: Draws a needle meter for a value in the range 0 to 100.
Inputs
VAL: value of type Value.X: value of type Value.Y: value of type Value.W: value of type Value.
Output
- None (statement block).
When to use it
- When you want an analog acting value indicator.
- For dashboard display of one main quantity.
Tips and pitfalls
- Gauge value is always clamped to 0-100.
- The block only changes the framebuffer; to display the hand on the display call
oded_refresh.
Generated Python example
oled_charts.draw_needle_meter(fbuf, _chart_int(0), _chart_int(0), _chart_int(0), _chart_clamp(_chart_float(0), 0, 100))