Data points and dashboard elements
Dashboard connects the program and its control panel using data points. Elements determine how you display or change these points.
The data point is not a panel element
Data point represents one transmitted value with the given type and direction of communication. Creates exactly one external input on the Dashboard block.
Element is its workspace display or controller. You can assign one data point to several elements: for example, a number and a graph, or a slider and a numeric display at the same time. They all work with the same value; they do not cause additional block inputs.
Manage data points
In Edit mode, open Data points and click on + Add. In the list, you select the point whose data you want to edit.
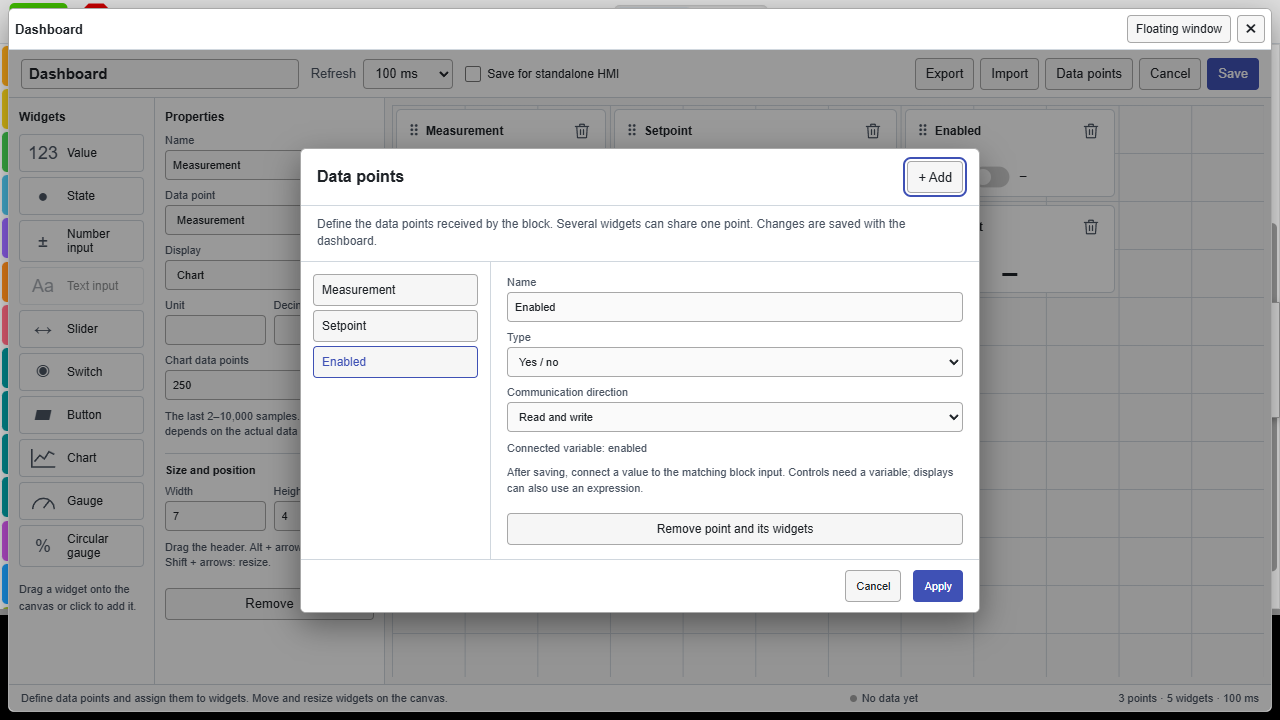
| Item | What sets the |
|---|---|
| Name | Clear description of the point. It does not have to match the variable name in the program. |
| Type | Type of transmitted value: integer, decimal, yes/no or text. |
| Communication direction | Whether the program provides the value to the panel, receives changes from the panel, or both. |
| Connected Variable / Connection Information | Data recognized from the block's external input. You don't select a variable here; you connect it on the Blockly workspace. |
| Remove point and its widgets | Removes a point and all elements that use it. To remove only one view, delete the element itself. |
The new point starts as Decimal with direction Read and write. Set them according to the actual purpose; you usually need Read from processor for just displaying measurements.
Apply accepts changes to the design in progress. Cancel in point management will return the state before opening it. Finally, confirm the entire design with the Save button in the dashboard editor.
Value types
| Type | What is |
|---|---|
| Integer | Numbers, indices and numerical values without a decimal part. For numeric controls, use integer range and step. |
| Decimal | Measurements and settings that can have a decimal part. The number of displayed decimal places is set separately on the element. |
| Yes / no | Boolean values, such as enabled/disabled. Used by Status and Switch. |
| Text | Text messages and string input. It is not a numerical value just because it contains digits. |
After changing the type or direction, check the connected elements. An unsupported display can be replaced by the editor with the generic element Value.
Communication directions
The direction is named from the processor's point of view, not from the screen's point of view.
| Choice | Value stream | What to connect to the input block |
|---|---|---|
| Read from processor | Program → panel | A variable or other read value or expression. |
| Write to processor | Panel → program | Direct read block of the variable in which the received value is to be stored. |
| Read and write | Program ↔ panel | Direct read block variable; the program displays it and the panel can change it. |
For a regular controller with a value display back, use Read and write. If you want to monitor the actual state of the program, choose read or bidirectional transfer, not just write.
Connecting to the Blockly workspace
After saving the design, the Dashboard block has one entry for each data point. The label corresponds to its name.
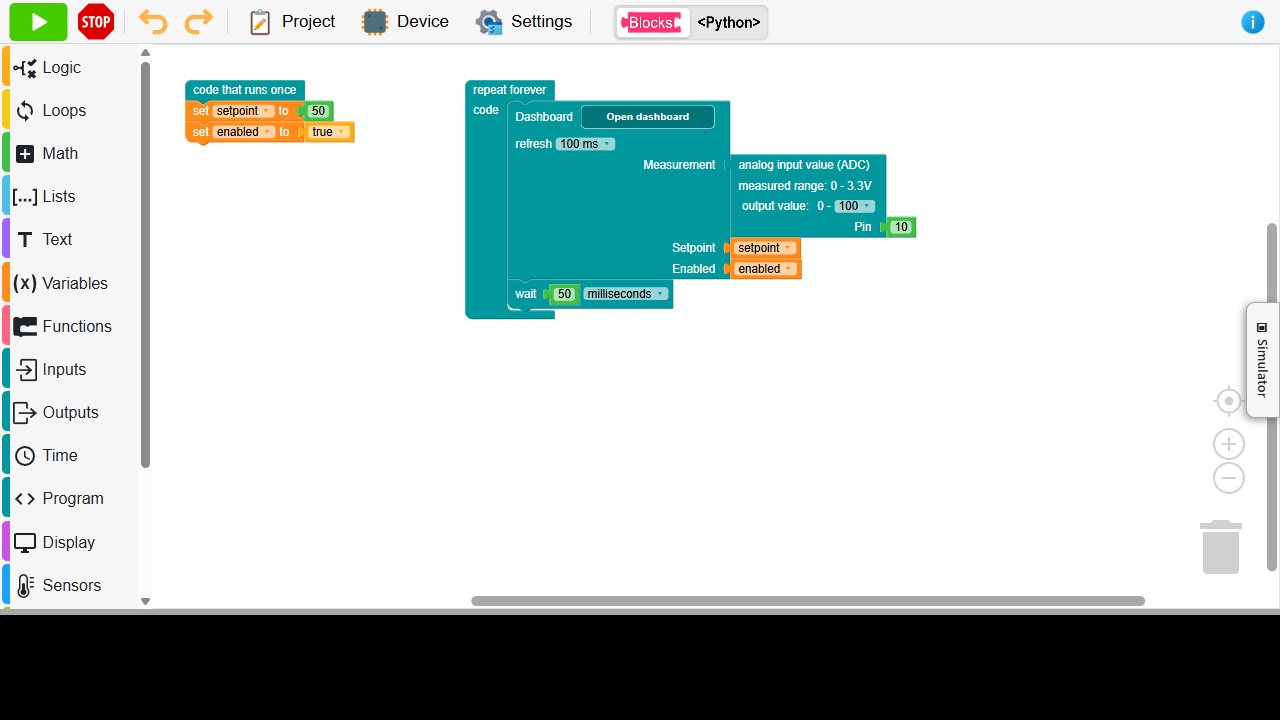
- For display you can directly connect a measurement, calculation, text or a variable of the corresponding type.
- For control connect a regular variable read block. An expression of the type sum of two numbers does not have a single place to write the received value.
- Initial values set before the first pass through the dashboard, for example in the initial part of the program.
Each input is evaluated once when traversing the block. The generated program takes the received changes and assigns them to the appropriate variables. Further behavior is already determined by your program.
The program can overwrite the value again
If you unconditionally set the controlled variable back to a fixed number in each pass through the loop, the change from the panel may not last. Therefore, the one-time default does not belong to the recurring part. Also, the driver itself does not turn on the motor or the LED: the program must actually use the received variable.
Renaming a variable in a project preserves its binding. But check the connection again after disconnecting the input, removing the variable or changing the configuration.
Overview of elements
The menu of available views is based on the type of point and the permitted direction of communication. Write drivers are not provided for a read-only point from the processor.
| Element | Value type | What is |
|---|---|---|
| Value | All four types | Displays the last received value; for numbers it can have unit and decimal places set. |
| State | Yes / No | Status indicator with yes/no text. It just displays the value. |
| Number input | Integer or decimal | Direct entry of a new value into the program. Requires write enabled. |
| Text input | Text | Entering a string. Requires write enabled. |
| Slider | Integer or decimal | Value setting by dragging, −/+ keys or numeric field. Requires write enabled. |
| Switch | Yes / No | Toggling a logical value. Requires write enabled. |
| Button | All four types | When clicked, writes one preset value. Requires write enabled. |
| Chart | Integer or decimal | It shows the history of a single point according to the actual times of receiving data. |
| Gauge | Integer or decimal | Arc indicator of the value between the set minimum and maximum. |
| Circular gauge | Integer or decimal | Circular representation of the position of the value in the range. When using for percentages, set the appropriate range and unit. |
Setting the selected element
| Property | Meaning |
|---|---|
| Name | Custom title of a specific element. Without it, the name of the data point is used. |
| Data point | The value that this element uses. Multiple elements can have the same point. |
| Display | Changing the type of an element within the limits of what the point supports. |
| Unit | Displayed complement of the number, for example °C or %. It does not calculate the value itself. |
| Decimal places | Number of places displayed, 0-8. Formats the display, does not change the calculation in the program. |
| Minimum / Maximum | The range of a controller or pointer. The minimum must be less than the maximum. |
| Step | Number or slider change size; must be positive. For an integer, use the integer setting. |
| Text for yes / Text for no | Custom logical state labels. It does not change the point type to text. |
| Value written by button | The exact value sent when the Button is clicked. |
| Chart data points | The highest stored number of displayed samples for a given graph. |
| Width / Height | Dimensions of the element in the editor grid. |
Some fields are displayed only for the corresponding element type. The scope of the slider is not a general variable protection in all parts of the program; the program can change it itself and outside of it.
For a circular pointer, it determines the minimum and maximum filling of the circle. But the number inside remains the accepted value; the indicator itself does not convert it into percentages. If you want to display data from the 0-1 range as 0-100%, perform the conversion in the program or the attached reading expression.
How control is confirmed
For numeric or text input, confirm the change with Enter or exit the field. The slider shows a preview when dragging, it sends the value when the change is confirmed, typically after release. Its −/+ buttons change the value by step; you can also enter the number directly. Escape in the number field of the slider cancels the change in progress.
Button is not automatically held/released. Writes the set value when clicked and does not send the opposite one when released. If the variable is to change state again after processing the command, the program must ensure this.
Graph and history
The graph shows one data point. Add another chart for another quantity. Two graphs of the same point can have different numbers of stored samples.
- Number of points in the chart: 2 to 10,000, default 250.
- The timeline is based on actual data reception, not just multiplying the refresh set.
- The vertical axis adjusts to the displayed data.
- The history is in the memory of the open browser panel. It fills up again after reloading.
.espdash.jsonexport does not transfer history.
Covers 250 points in about 25 seconds with a regular transmission of 100ms. With less frequent program passes or irregular dates, the actual length will be different. The timeline and last update information are decisive.