Debugging the program
Block debugging helps you find out where the program goes and what values its variables have. You can just watch the highlighted blocks, slow down the execution or stop the program at a selected point and continue by individual commands.
The function is part of ESP IDE. Applies to projects in Blocks mode; block debugging is not added to a separate text tab at startup.
Where to start
| I want to… | Use |
|---|---|
| See where the program is currently going | Block Highlighting |
| Stop before a specific command | Breakpoint |
| Execute commands one at a time | Next block |
| Monitor the values and do not stop the program | Tracepoint |
| Temporarily traverse breakpoints without stopping | Stop at breakpoints |
| Understand the values or solve a connection problem | Debug window and problems |
Highlight and slow down
In the Settings → Program Debugging menu, select the mode. For new or older setups that do not include this option, Off is used.
| Option | What it does |
|---|---|
| Off | It will not add block debugging, breakpoints, or tracepoints to the program the next time it is run. You can leave the tags in the project ready. |
| Immediate | Turns on debugging with no added wait between blocks. It's also useful for breakpoints and tracepoints, if you don't want to deliberately slow down the program. |
| Block/100ms | Inserts a 100ms wait between debug steps. |
| Block/250ms | Inserts a 250ms wait between debug steps. |
| Block/500ms | Inserts a half-second wait between debug steps. |
| Block/1s | Inserts a one second wait between debug steps. |
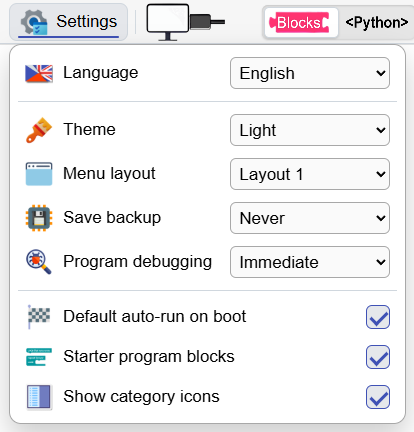
After selecting the mode, press Run code. The IDE prepares the debugger together with the program and runs it in the attached board or simulator.
The highlight indicates where the execution occurred. It is reported before the command is executed, so this particular block may remain highlighted during a slow operation. It is not a processor load meter or an accurate record of the time of individual operations.
For the first acquaintance, try Block/500ms
You can easily see the order of commands. To debug a timing-sensitive program, switch to Immediate and place a breakpoint or tracepoint only where you are interested in the state.
What changes only at the next start
Point locations and decelerations are prepared when the uploaded program is generated. After changing the mode, adding points or editing the code, stop the program and start it again.
The Off option is not a command to cancel an already loaded breakpoint. A new run with debugging disabled is required to remove the debug handler from the runtime. Temporarily continuing without stopping is addressed by a separate switch in debug window.
Simply moving blocks around the debug surface does not invalidate. But when you change their links, values or content, the IDE stops displaying the highlights according to the old uploaded program. Relaunch the new form first.
Which tracking method to choose
| Method | Does it stop the program? | Does it show variables? |
|---|---|---|
| Highlighting without debug points | No; slow mode adds delays. | No. |
| Breakpoint | Yes, before the marked block. | Yes, status at stop point. |
| tracepoint | No; does the sending of values and continues. | Yes, the latest snapshot. |
| Breakpoint with stopping disabled | No; point is used to send values. | Yes, as a tracepoint. |
Highlighting alone does not open the variables window. This is used for running with breakpoints or tracepoints.
Good to know
- Immediate mode does not guarantee that you will see every quick block. Highlight-only messages are limited to approximately one per 50ms, and the screen refreshes according to the browser.
- Deceleration, stop and transfer of values change the timing of the program. Especially for games, communication and motion control, also compare running with Off tuning.
- Stopping the program at a point does not by itself turn off already set outputs. A lit LED can continue to light; the last set value of the output is not automatically reset.
- The regular Python preview shows a standard generated program. Helper debugging functions are added separately for startup; their absence in the preview does not mean that debugging is inactive.
- The terminal remains available for displaying errors and custom listings. The IDE separates debugger communication messages from regular output.