OLED charts: segment indicator (internal_oled_draw_segmented_gauge)
What it does: Draws a segmented linear indicator with an adjustable number of segments.
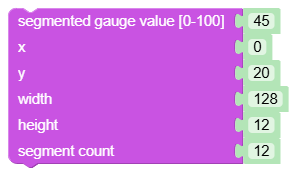
Inputs
VAL: value of type Value.X: value of type Value.Y: value of type Value.W: value of type Value.H: value of type Value.SEG: value of type Value.
Output
- None (statement block).
When to use it
- When you want a step-by-step display of the value by parts.
- For "how many segments are active" status indicators.
Tips and pitfalls
- Number of segments
SEGis converted to integer by helper_chart_int. - For readable display, use a positive number of segments and a value of
VALin the range 0-100.
Generated Python example
oled_charts.draw_segmented_gauge(fbuf, _chart_int(0), _chart_int(0), _chart_int(0), _chart_int(0), _chart_clamp(_chart_float(00