OLED graphs: signal strength (internal_oled_draw_signal_strength)
What it does: Plots a signal strength indicator for a value in the range 0 to 100.
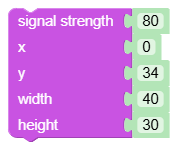
Inputs
VAL: value of type Value.X: value of type Value.Y: value of type Value.W: value of type Value.H: value of type Value.
Output
- None (statement block).
When to use it
- When you want to display the quality of Wi-Fi or radio connection.
- For communication diagnostic screen.
Tips and pitfalls
- Input
VALis normalized only by trimming to 0-100 (without further conversion of units). - If you have RSSI or another scale, convert it to percentages before this block.
Generated Python example
oled_charts.draw_signal_strength(fbuf, _chart_int(0), _chart_int(0), _chart_int(0), _chart_int(0), _chart_clamp(_chart_float(00